Last year, a colleague and I made a small spectrophotometer-workshop for kids in my school’s science classes. In brief they had to assemble something like this:
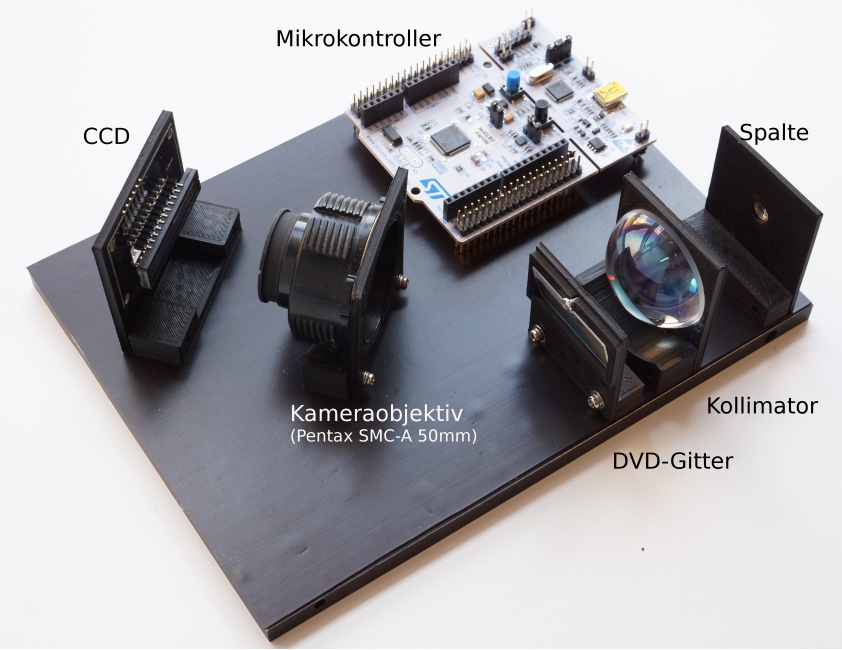
The “optical table” is a 15x20x0,8 cm aluminium plate covered with 0,6 mm self-adhesive ferrofoil and all the optical components have magnetic feet.
The students were first asked to characterize the DVD-grating using 532 nm laser pointers and a bit of trigonometry. Then we had them calculate the geometry of the spectrophotometer and finally they were asked to place all the components according to their calculations.
(Ok, it wasn’t that brief, the students spent 4x 90min in the lab, and they received a bit more wisdom than what’s outlined here, I’m just to lazy to do a full write-up)
It was fun (and I hope the kids thought so too, if nothing else they were bribed with cake during each lab-session), but I had underestimated the problems we’d encounter setting up their computers to work with the linear CCD module – Windows was particularly hard to play with.
This year we’re redoing it, and during the holidays I’ve been trying to learn enough python 3 to write a platform-independent graphical user interface for the CCD, so hopefully we can concentrate on the fun stuff next time.
Anyway, the new GUI looks like this:
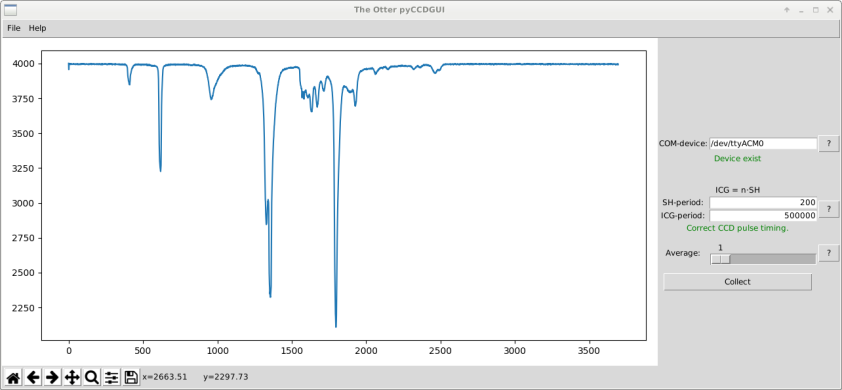
I’ve only scratched the surface of matplotlib, so I expect to add more features, for now it can do just the basic stuff.
Get it here: python interface for the TCD1304
I will create stand-alone executables for macOS and windows in the coming days.

Hi. Are you planning any more updates?
LikeLike
yes. I want to include transmittance, absorbance, and wavelength calibration. the updates may or may not be featured here. but for sure, you can always find the latest at https://tcd1304.wordpress.com
(and in case you didn’t see, there was already an update – for showing intensity rather that ADC-count)
LikeLike